Model: EasyPlot
Supplier: S.I. Instruments
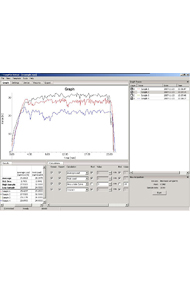
EasyPlot Software is a simple yet powerful data acquisition and analysis package designed for logging, plotting, and evaluating force and torque measurement data. Compatible with a wide range of force and torque gauges, EasyPlot provides a cost-effective solution for capturing test data, generating graphs, and performing detailed analysis.
The software automatically records test results and performs calculations for individual samples, while also enabling comparison across multiple tests. Its intuitive interface allows users to quickly visualise data, identify trends, and generate meaningful reports for quality control, research, and product development applications.
With built-in statistical tools and spreadsheet export capabilities, EasyPlot simplifies the management and analysis of force and torque testing data.
Typical Applications
- Force and torque testing data acquisition
- Quality control and production testing
- Materials testing and product validation
- Packaging and closure testing
- Tensile and compression testing
- Research and development projects
- Comparative analysis of test samples
- Laboratory reporting and documentation
Analysis Features
- Area under the curve
- Average load
- Load at a specified time
- Peak load
- Slope calculation
- Trough detection
Statistical Functions
- Average values
- Standard deviation
- High and low sample comparison
- Easy export to spreadsheet applications
Key Features
- Simple and user-friendly operation
- Data logging and graphing capabilities
- Force and torque data analysis
- Automatic calculation of test parameters
- Comparative sample analysis
- Statistical reporting tools
- Spreadsheet export functionality
- Cost-effective solution for test data acquisition and reporting
Benefits of EasyPlot Software
- Eliminates manual data recording
- Reduces calculation errors
- Provides clear graphical representation of test results
- Simplifies trend analysis and product comparison
- Generates professional reports for quality documentation
- Improves traceability and record keeping
- Supports data-driven decision making
Example EasyPlot Data Reports
EasyPlot can generate a variety of reports depending on the test type and analysis requirements. Below are examples of the types of reports commonly produced.
1. Force vs Time Report
Application: Compression testing, push-button testing, spring testing
| Time (s) | Force (N) |
|---|---|
| 0.0 | 0.0 |
| 0.5 | 12.5 |
| 1.0 | 25.8 |
| 1.5 | 38.2 |
| 2.0 | 40.1 |
Automatically Calculated:
- Peak Force: 40.1 N
- Average Force: 29.2 N
- Time to Peak: 2.0 s
Graph Output: A force-versus-time curve showing how force changes throughout the test cycle.
2. Force vs Distance Report
Application: Tensile testing, packaging tests, peel tests
| Distance (mm) | Force (N) |
|---|---|
| 0.0 | 0 |
| 5.0 | 15 |
| 10.0 | 31 |
| 15.0 | 45 |
| 20.0 | 52 |
Automatically Calculated:
- Peak Load: 52 N
- Extension at Peak Load: 20 mm
- Area Under Curve (Work/Energy)
Graph Output: A force-versus-distance graph illustrating material behaviour during testing.
3. Closure Torque Report
Application: Bottle cap and closure testing
| Sample | Opening Torque (N·m) |
|---|---|
| 1 | 1.25 |
| 2 | 1.18 |
| 3 | 1.22 |
| 4 | 1.21 |
| 5 | 1.27 |
Statistical Summary
- Average: 1.23 N·m
- Maximum: 1.27 N·m
- Minimum: 1.18 N·m
- Standard Deviation: 0.03 N·m
Graph Output: Bar chart or trend graph comparing closure torque between samples.
4. Batch Comparison Report
Application: Quality control and production monitoring
| Batch | Average Force (N) | Standard Deviation |
|---|---|---|
| Batch A | 125.4 | 2.1 |
| Batch B | 122.8 | 3.5 |
| Batch C | 127.1 | 1.8 |
Automatically Generated Analysis
- Highest-performing batch
- Lowest-performing batch
- Batch-to-batch variation
- Process consistency trends
5. Pass/Fail Report
Application: Production testing
Specification Limits
- Minimum Force: 100 N
- Maximum Force: 120 N
| Sample | Result (N) | Status |
|---|---|---|
| 1 | 105 | PASS |
| 2 | 118 | PASS |
| 3 | 98 | FAIL |
| 4 | 111 | PASS |
Summary
- Total Tests: 4
- Pass: 3
- Fail: 1
- Yield: 75%
6. Statistical Summary Report
EasyPlot can automatically calculate and display:
- Average
- Maximum
- Minimum
- Standard Deviation
- Coefficient of Variation
- Peak Values
- Area Under Curve
- Slope Analysis
These reports can be exported directly to Microsoft Excel for further analysis and inclusion in quality documentation.
Industries Using EasyPlot Reports
- Packaging & Closure Testing
- Medical Device Testing
- Beverage Industry Testing
- Materials Testing
- Automotive Components
- Electronics Manufacturing
- Research & Development
- Quality Control Laboratories
Choose S.I. Instruments for precision you can trust, compliance you can rely on, and service that delivers confidence.